Professional Infographic Design Services in the USA
Infographics are a powerful tool for presenting content in an engaging and visually appealing format in the United States. They have the potential to go viral and attract widespread attention. Our expertise ensures we design and create the perfect infographics tailored to your business and industry needs. With a focus on high-impact visuals, we transform complex information into clear, memorable graphics that drive results and resonate with your audience.
Custom Infographic Design Solutions for Your Brand’s Unique Needs
Our custom infographic design solutions are meticulously created to meet your brand’s unique requirements. We specialize in transforming intricate data and information into visually compelling graphics that not only capture attention but also enhance understanding. Each design is tailored to align with your brand’s identity and messaging, ensuring a cohesive and impactful visual experience.
By focusing on your specific needs, we create infographics that effectively communicate your key points and drive engagement. Our team works closely with you to ensure that every element of the design is strategically chosen to reflect your brand’s voice and goals, providing a clear and memorable representation of your message.
Our approach combines creativity with strategic insight, resulting in infographics that stand out in a crowded marketplace. With our solutions, you can expect designs that not only convey information effectively but also resonate with your audience, making a lasting impression and reinforcing your brand’s presence.
Key Advantages and Benefits of Professional Infographic Design Services
Professional infographic design services enhance clarity and engagement by turning complex data into visually appealing, easy-to-understand graphics. They ensure brand consistency and strategic alignment, making your content more shareable and impactful. With expert design, businesses save time and achieve accurate, high-quality results tailored to their needs.
- Clarity and Simplicity: Professional designers excel at distilling complex information into clear, easy-to-understand visuals, making it simpler for your audience to grasp key points quickly.
- Engaging Visuals: Expert infographic design services create visually appealing content that captures attention and maintains viewer interest, which can lead to higher engagement and retention rates.
- Brand Consistency: Skilled designers ensure that infographics align with your brand’s visual identity, including color schemes, fonts, and style, which helps in maintaining brand consistency across all marketing materials.
- Enhanced Communication: Infographics are effective at breaking down complex data and concepts into digestible chunks, improving communication and understanding among your target audience.
- Professional Quality: Professional design services bring a high level of expertise and technical skill, resulting in polished, high-quality infographics that reflect well on your brand.
- Time Efficiency: Outsourcing infographic design to professionals saves you time and effort, allowing you to focus on other aspects of your business while experts handle the creation of impactful visuals.
- Strategic Design: Designers use strategic approaches to ensure that infographics are not only visually appealing but also strategically created to achieve specific marketing or communication goals.
- Increased Shareability: Well-designed infographics are more likely to be shared on social media and other platforms, increasing your content’s reach and potential for virality.
- Data Accuracy: Professional designers are adept at presenting data accurately and effectively, ensuring that your infographics are both informative and trustworthy.
- Customized Solutions: Infographic design services offer tailored solutions that meet your specific needs and objectives, whether you require a series of infographics or a single, stand-alone piece.
Discover the Range of Exclusive Packages We Offer
Explore types of tailored solutions designed to meet your needs and exceed your expectations. From essentials to premium packages, we have something for everyone.
Explore Our Comprehensive Custom Infographics Design Offerings
Discover how our tailored infographic design services can bring your brand’s vision to life. From compelling data visualizations and engaging charts to innovative graphic elements and versatile layouts, we offer a range of custom design solutions to create impactful and memorable infographics. Explore our diverse offerings to find the perfect visual representation for your business.
Explore our extensive range of custom infographic design offerings
Infographics are powerful tools that present information in a visually engaging way. They turn complex data and processes into clear, accessible visuals that capture attention and enhance understanding. By using different types of infographics, you can effectively communicate your message and improve information retention. These tools simplify complex topics and boost audience engagement.
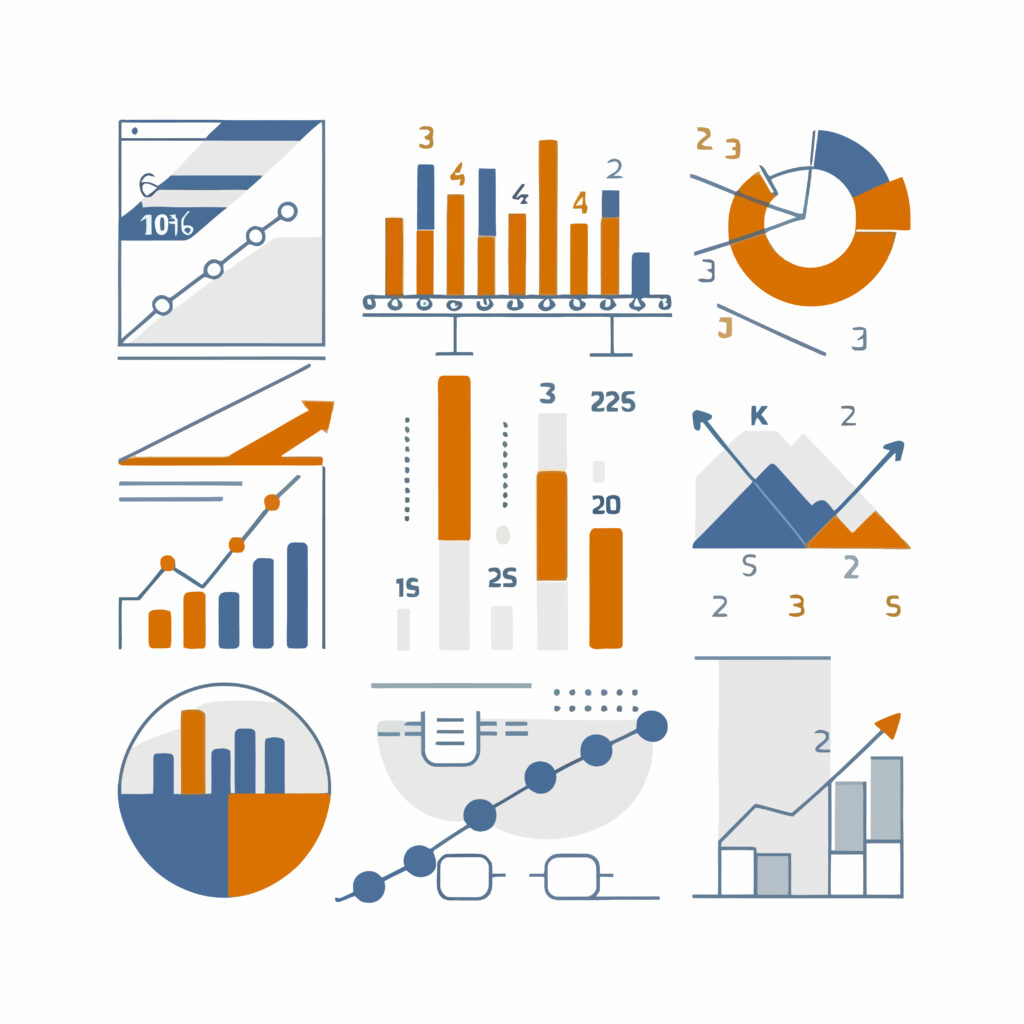
Statistical Infographics
Statistical infographics are specifically created to present quantitative data in an engaging and easy-to-understand manner. They excel in translating complex numerical information into visual formats that are accessible to a broad audience. Key features include:
- Charts and Graphs: Bar charts, pie charts, line graphs, and scatter plots help to visualize numerical data.
- Data Tables: Organized tables that provide a detailed view of data.
- Icons and Illustrations: Represent data points in a more visually appealing manner.
- Uses: Ideal for conveying research findings, survey results, or any data-driven insights. They make complex data more understandable by turning numbers into visual representations.
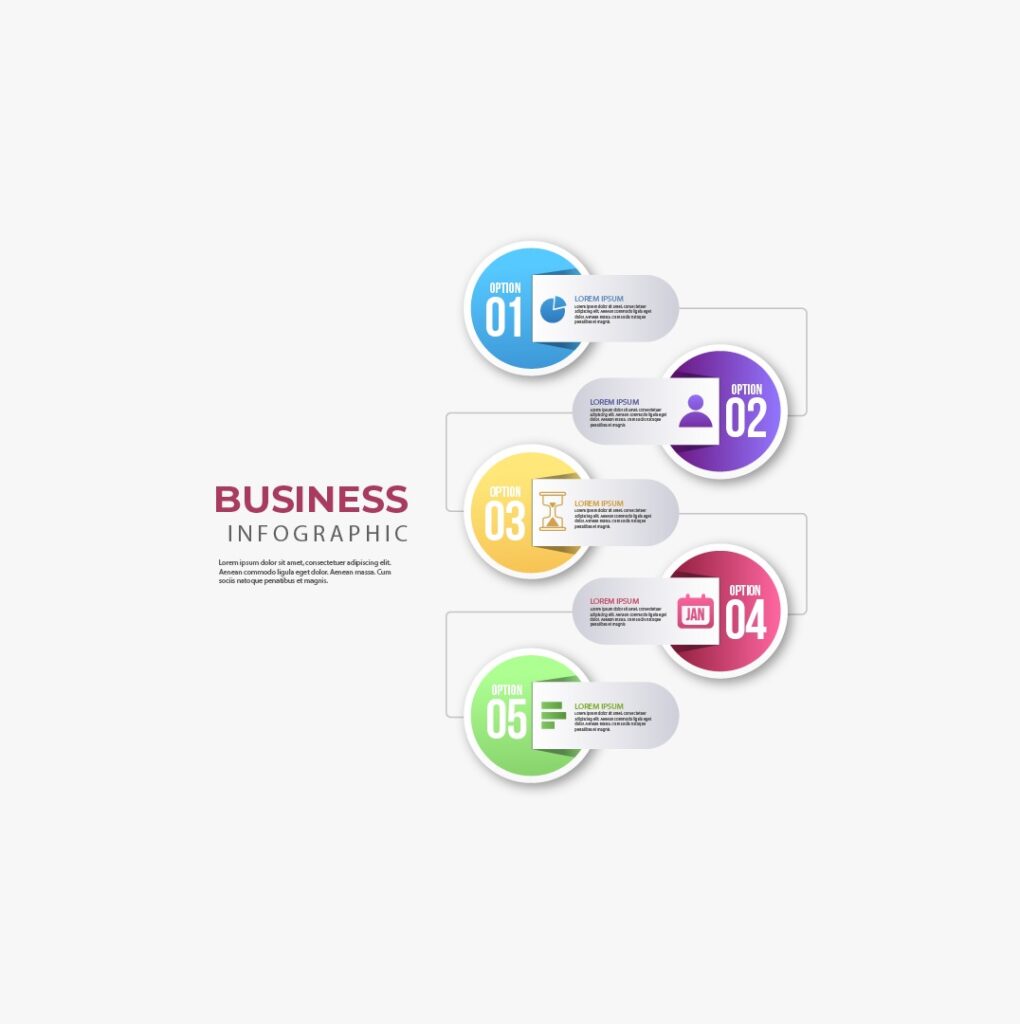
Informational Infographics
Informational infographics are designed to provide a comprehensive explanation of a particular topic. They are highly effective in breaking down complex information into digestible, visually appealing segments. Key features include:
- Textual Descriptions: Detailed text that explains key concepts or information.
- Visual Aids: Icons, images, and diagrams that help illustrate points.
- Flowcharts: Show the progression or relationship between concepts.
- Uses: Useful for educational content, how-to guides, and detailed explanations where the goal is to inform or educate the audience about a specific topic.
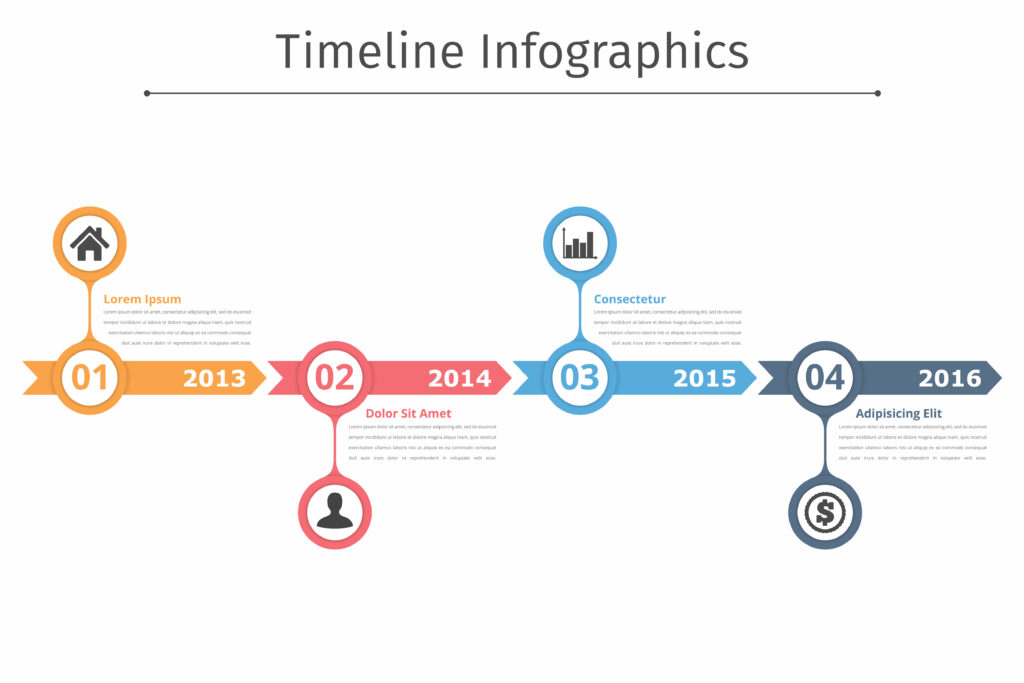
Timeline Infographics
Timeline infographics are designed to showcase events, milestones, or processes over a specified period. They offer a visual representation of temporal sequences, making it easier to understand the progression of events. Key features include:
- Chronological Layouts: Represent events in sequential order.
- Date Markers: Clearly labeled dates or periods.
- Visual Elements: Illustrations or icons to represent events or phases.
- Uses: Perfect for showing historical events, project development stages, or the evolution of a concept or product. They provide a clear visual of how things progress over time.
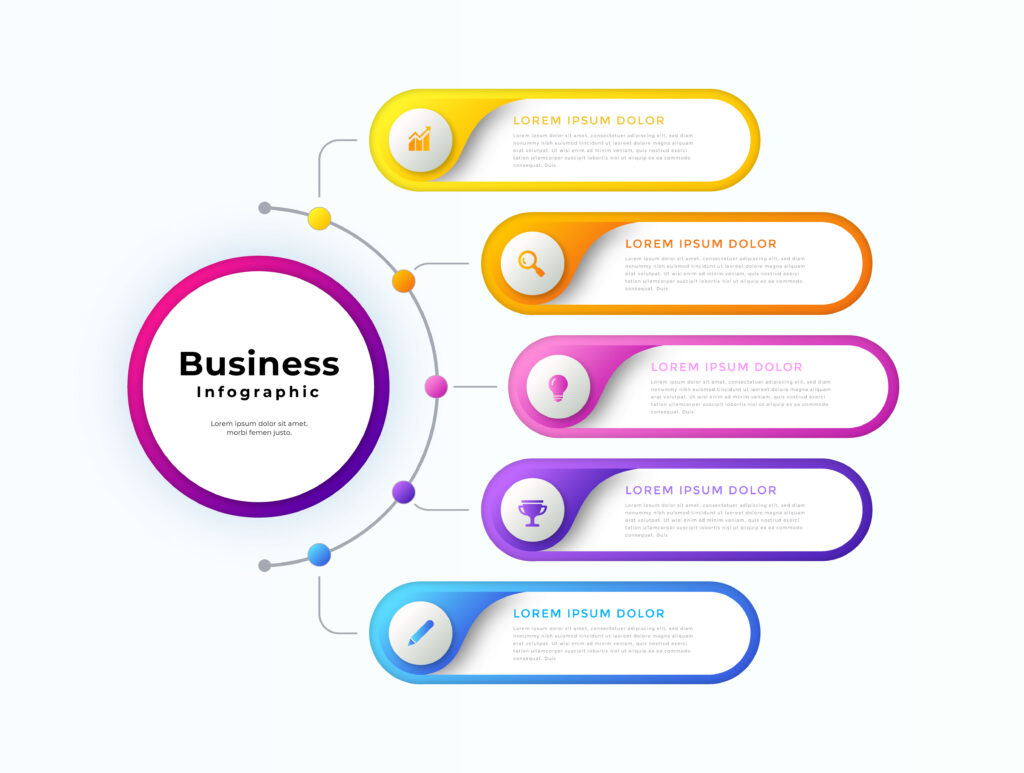
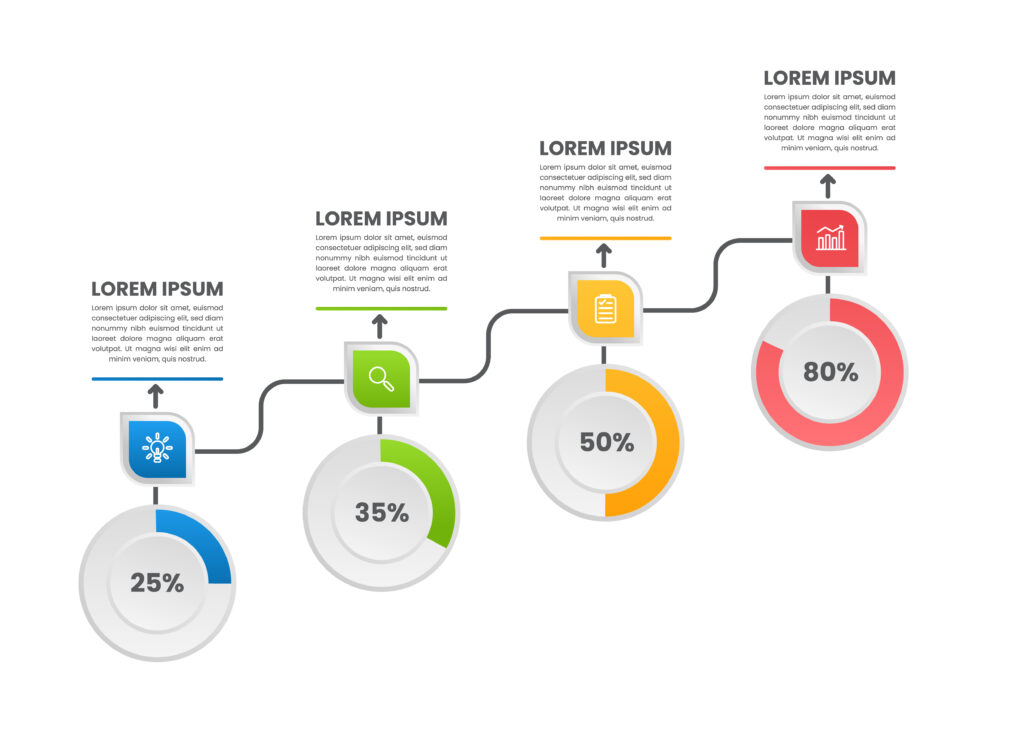
Process Infographics
Process infographics outline the steps involved in a procedure, workflow, or system, making complex processes easier to understand. Key features include:
- Step-by-Step Diagrams: Visual representations of each step in a process.
- Flowcharts: Show the flow from one step to the next.
- Icons and Illustrations: Help represent each stage of the process visually.
- Uses: Effective for instructional content, guides, and tutorials. They simplify complex procedures by breaking them down into manageable steps.
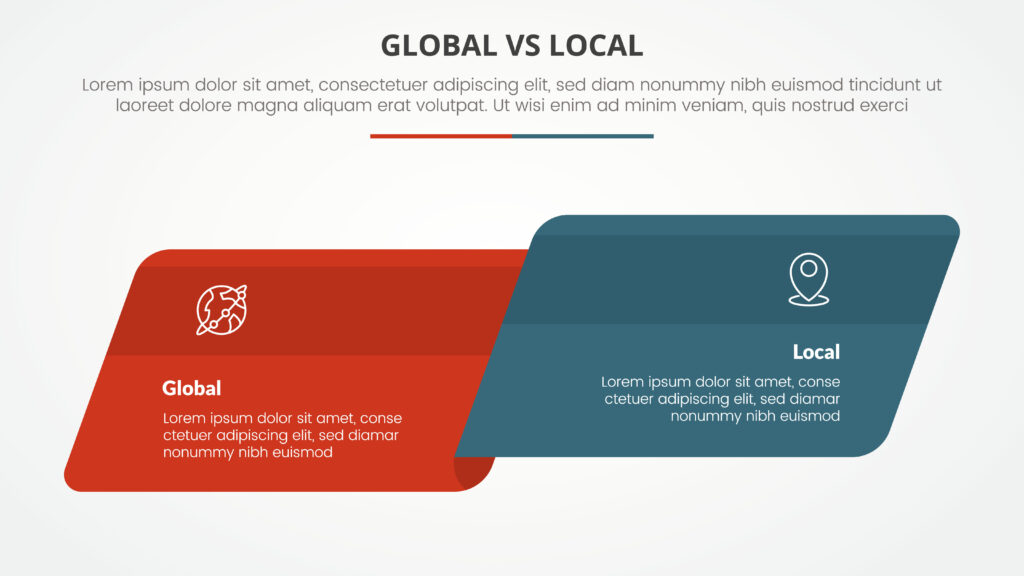
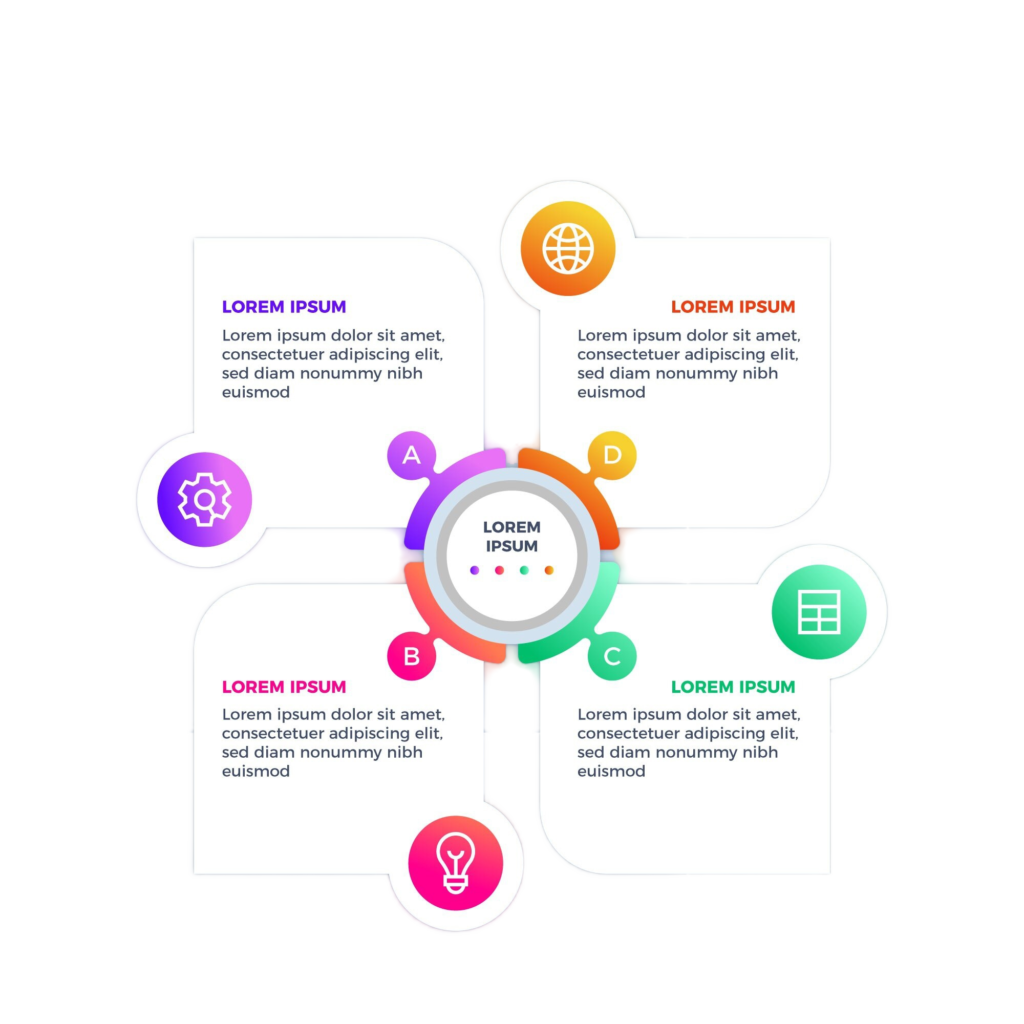
Comparison Infographics
Comparison infographics are used to highlight similarities and differences between two or more items, concepts, or options. They provide a visual means of evaluating multiple elements side by side. Key features include:
- Side-by-Side Layouts: Compare items directly for easy visual differentiation.
- Comparison Charts: Highlight features or characteristics of each item.
- Icons and Graphics: Represent different aspects being compared.
- Uses: Useful for product comparisons, feature evaluations, and decision-making processes where viewers need to understand the pros and cons of different options.
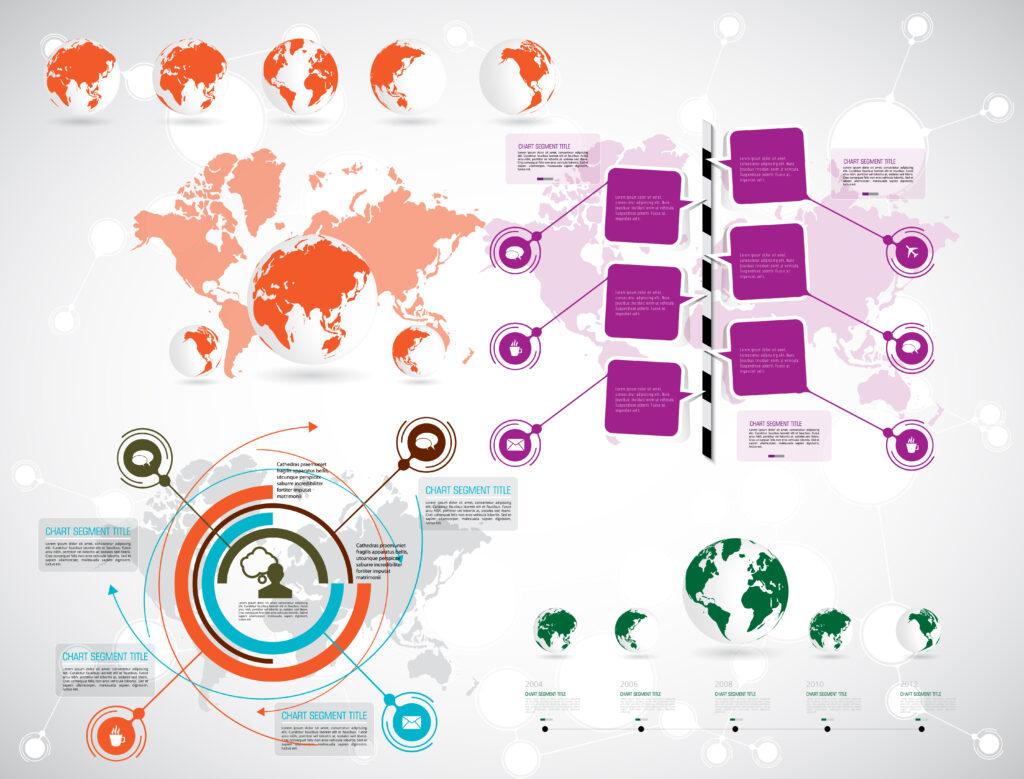
Geographical Infographics
Geographical infographics use maps and location-based data to illustrate trends or patterns across different regions. They provide insights into spatial relationships and regional variations. Key features include:
- Maps: Detailed or stylized maps to show geographical data.
- Heat Maps: Indicate the intensity or concentration of data across regions.
- Location Markers: Highlight specific places or regions of interest.
- Uses: Ideal for presenting regional statistics, demographic information, or geographic trends. They help viewers understand spatial relationships and regional differences.
Ready to Create an Infographic ?
What Makes Animotions Studio the Best Infographic Design Company?
At Animotions Studio, we excel in creating impactful infographics that effectively convey your message. Our team blends creativity with strategic insights to deliver designs that not only stand out but also engage your target audience. With a commitment to quality and a client-centric approach, we ensure that your infographic is not just a visual but a powerful tool for communication and engagement.
We Capture Your Vision
we take a collaborative approach to create infographics that authentically represent your brand’s data and message. With years of diverse experience, we excel at understanding your core ideas and transforming them into compelling visuals. Whether you need to present complex data or tell a story, our infographic design services are here to create your vision.
We Align Ideas with Expectations
Our custom infographic design service seamlessly integrates your data with audience expectations. By merging your brand message with carefully researched design elements, we create infographics that captivate and inform your audience. Partner with the leading infographic design company in the USA to enhance your content’s appeal and effectiveness.
We Infuse True Value into Every Infographic
Our meticulous design process begins with in-depth research to understand your data and objectives. This approach allows our expert designers to create infographics that offer real value, incorporating engaging visuals and audience-centric designs to drive your message forward.
Comprehensive Graphic Design Solutions
Our extensive portfolio highlights our expertise across various industries, showcasing the high quality of our graphic design services. Beyond stunning infographics, we offer a full range of branding and promotional design services for mobile apps, websites, and social media. Create your marketing materials with our premier design solutions.
The Process of Working with a Professional Infographics Design Company
A professional infographics design company starts by understanding the client’s goals and target audience. They design visually engaging infographics using validated data and feedback. The process includes revisions to ensure accuracy and alignment with the client’s objectives.
Define the Purpose
To create an effective infographic, first define its main objective whether to educate, inform, entertain, or persuade. This clarity will guide your design and content strategy. Next, identify your target audience to tailor the content and design to their preferences and needs. Consider their interests and expertise to ensure the infographic is engaging and relevant.
Research and Gather Data
To create a reliable infographic, gather relevant data from reputable sources like academic papers, industry reports, and official statistics, ensuring the information is accurate and current. Validate the credibility of your sources and cross-check facts to prevent misinformation. The quality of your data will significantly influence the infographic’s overall reliability.
Plan the Content
Outline key points by organizing information into clear, digestible sections and prioritizing the main messages based on their importance. Develop a logical flow that guides viewers through the content, creating a narrative that makes the data engaging and easy to understand. Plan the sequence from introduction to conclusion to enhance the overall coherence and impact.
Design the Layout
Choose a design style that aligns with the infographic’s purpose and target audience, considering elements like color schemes, fonts, and overall aesthetics to enhance readability and appeal. Draft a wireframe to visualize the layout of text, graphics, and data, helping to organize content effectively and ensure a balanced design.
Create the Infographic
Use graphic design software like Adobe Illustrator, Canva, or Piktochart to create the infographic, incorporating elements such as charts, graphs, and icons for clear data representation. Apply design principles like contrast and alignment to guide the viewer’s attention and highlight key information, ensuring the infographic is visually appealing and impactful.
Review and Refine
Proofread the infographic for spelling, grammar, and factual errors, ensuring all data is accurate and text is clear. Seek feedback from colleagues or stakeholders and revise as needed. Make final adjustments to the design and content to ensure it meets its objectives and is ready for distribution. Double-check all elements for consistency and quality before finalizing.
Frequently Asked Questions (FAQs)
Customer Testimonials
Throughout our journey, Animotions Studio has consistently delivered high-quality projects. Here’s what our valued customers have to say about our video production services.
